The TL;DR
- Buzz is building around low-code in actuarial circles.
- As everyone knows, Excel has plenty of shortcomings.
- Low-code and high-code alternatives can improve many of Excel’s shortcomings, but they come with their own challenges.
- We use KNIME to demonstrate low-code workflows for a typical actuarial task, IBNR computation.
- Low-code platforms allow actuaries to think at a higher level of abstraction.
- Low-code platforms offer compelling advantages and should be evaluated as a replacement of Excel-based workflows and processes.
So Much Buzz
No doubt you have heard about low-code platforms. Perhaps you have seen them at a conference, talked to a low-code vendor or consultant, or even use them as part of your work. But no matter where you look, you will find little detail about what they are good for and how they will (often) improve your work. Plenty of why, but virtually no how or what.
There was an article recently in The Actuary talking about low-code systems. I agreed with what it said (mostly), but even I, a low-code adherent, was left wanting to know more. What sets me apart from the typical actuarial reader is my experience in low-code platforms. I have had the pleasure of working with a mature, powerful low-code environment and know just how powerful they are.
What environment is that, you may ask? Houdini. But that is a story for another day.
The Actuary’s Albatross
Excel is an extraordinary program. Supremely flexible and versatile. Even before it became Turing complete with the addition of the LAMBDA function, Excel with and without VBA has been a powerful tool for actuaries. So much so that an entire shadow IT environment has grown up around it in actuarial departments.
In 2021, Stephan Mathys wrote the article “Several Reasons Excel Should Not Be Your Production-Level Actuarial System” for the Smaller Insurance Company section. Without meaning to, he lays out great reasons why it is time to move on from Excel. I recount them here.
- Excel is a blank slate. Users must supply there own structure and design, among others. These are things actuaries are not trained to do.
- Excel has data and size limitations. Currently a bit over one million rows, it used to be much, much less. PowerQuery can handle greater than that, yet there are far better tools for handling such large amounts of data.
- Excel wasn’t designed for effective visual displays. Essentially an extension of the first item.
- Processing power is limited. Excel is stuck with the memory and CPU on your local machine.
- Version control is non-existent. In Excel. This requires ad hoc methods which are far from fool-proof, such as making copies with appropriate file names.
- Formula copy/paste practices. In short, how do I know that cell A356709 uses the same formula as cell A2 and A9120, if they are supposed to be identical?
- Excel itself has versions. Microsoft regularly iterates on improving Excel. For example, the LAMBDA function is a very recent addition.
- Undocumented or Unknown External References to Internal Components Can Lead to Data Pipeline Issues. External references to other workbooks and resources can break readily.
In short, we have stretched Excel far beyond its original design and intended uses.
Easing the Burden
Technology marches ever onward, and in 2024, we find ourselves awash in tools and systems which promise to improve efficiency, effectiveness, robustness, and performance. Despite that, many actuaries continue to use Excel for (almost) everything.
Much has been written about Excel’s shortcomings. What should replace it? Maybe some criteria could help to decide:
- Flexible: it needs to do all the things we might eventually need, even if we don’t know what those are yet.
- No arbitrary limitations: no limits on data sizes or ability to tap processing power, including distributed systems
- Versioning: versioning should be easy to use
- Transparency and clarity: future users, including yourself, should be able to understand the what, why, and how of the work being done
- Auditability: anything done in the environment can be readily reviewed and verified by auditors and peer reviewers
- Interoperability: it is easy to work with other software and systems (provided those systems reciprocate)
- Cost: it should not be unjustifiably expensive to purchase or maintain.
I can’t say that any replacement will satisfy these criteria for your needs. However, I hope this introduction and comparison gives you a sense of what you can expect.
Something Tangible
Let’s look at how an actuary would do a common task in a low-code environment. We will estimate IBNR by completing a claims triangle. Most actuaries should be familiar with how this is done. If not, the details of the case study are a good place to learn the basic idea.
I used the KNIME platform. I chose KNIME because it appears to be full-featured and mature, and you can run it at home. Note: I have no relationship whatsoever with KNIME or any purveyor of low-code anything.
The data were taken from the usmedclaims dataset from the CASdatasets package in R. Alternatively, you can get the data from Jed Frees’ website in support of his book, Regression Modeling with Actuarial and Financial Applications. The data are the MedicalCare triangle data found here.
As you will see, the visual programming approach is quite different from a pure Excel or pure code approach.
Building an IBNR Machine
I alluded to Houdini in the beginning of the post. That personal detour introduced me to the awesomeness of a fully mature, well-featured procedural (“low-code”) environment. Procedural environments permit a much higher level of abstraction than direct coding does while continuing to enable the use of code as needed.
Let’s start with the finished product. You can download the example here.
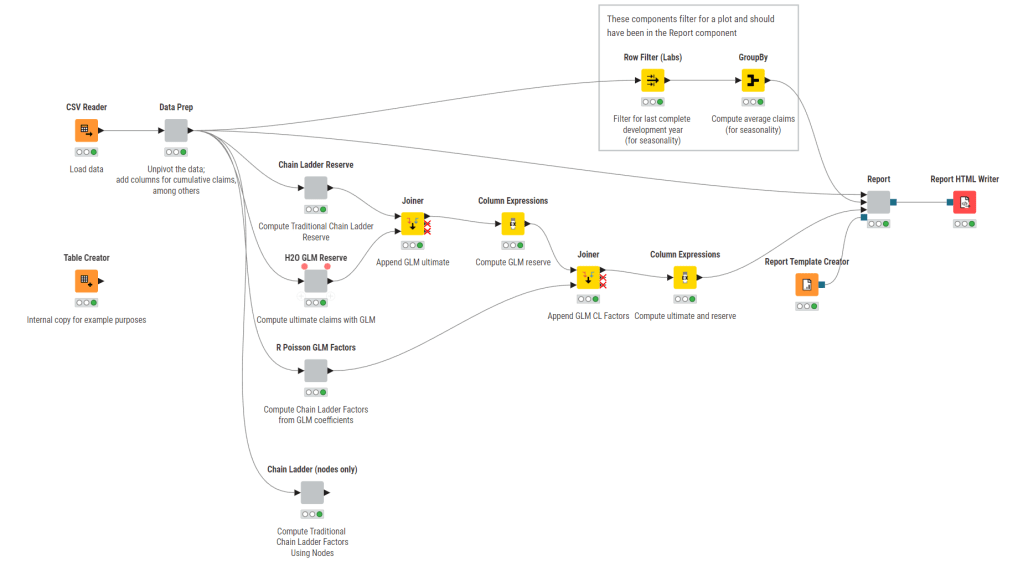
Each icon is a node, and it represents some action. The grey boxes are components, which are collections of nodes. Each node is named and has a comment underneath describing what it does.
Let’s dive into Data Prep, the first grey node.
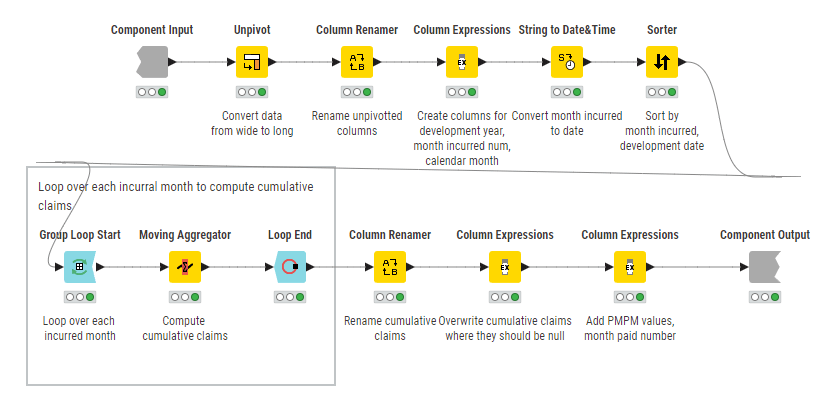
This is a common pattern: a “straight line” of operations, here arranged to be more readable for the web. It is very clear what is going on even without diving into the details of each node. We also see a downside of low-code systems – that everything must be a node, no matter how basic, such as creating or renaming columns.
A keen eyed reader might notice something useful. This happens to be a self-contained, reusable component.
Chain Ladder with Nodes
Back up to the main node graph, the grey node at the bottom, “Chain Ladder (nodes only)”, is how I was able to set up the quirky computations of IBNR using only nodes.
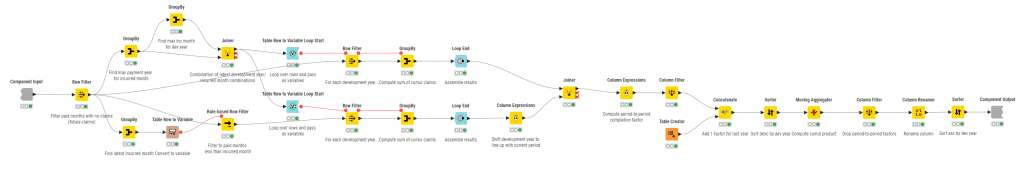
Things are starting to get complicated, but the complexity can be followed and remains clear overall. Better commenting would make things even better. The left half performs the summations by development year so that the period-to-period factors can be computed on the right.

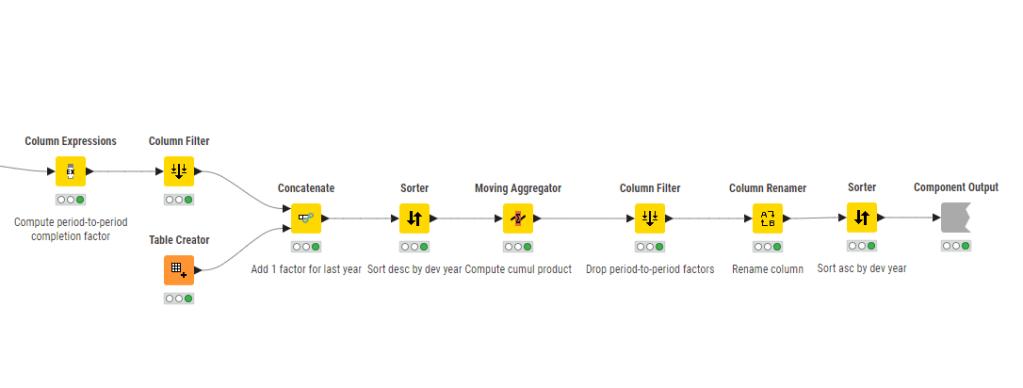
I find this rather fiddly to do a simple computation. Recall that a nodes-only approach requires a node for every step, no matter how basic. This aspect can lead to situations where there are a lot of nodes with crossing flow paths making it hard to read. This phenomenon is called “node spaghetti” in some circles. It tends to work against readability and clarity.
Chain Ladder with Embedded Code
Low-code environments worth their salt will allow code nodes into their workflows. The upside is that it allows significant customization and optimization. The downside is that it introduces the negatives of code.
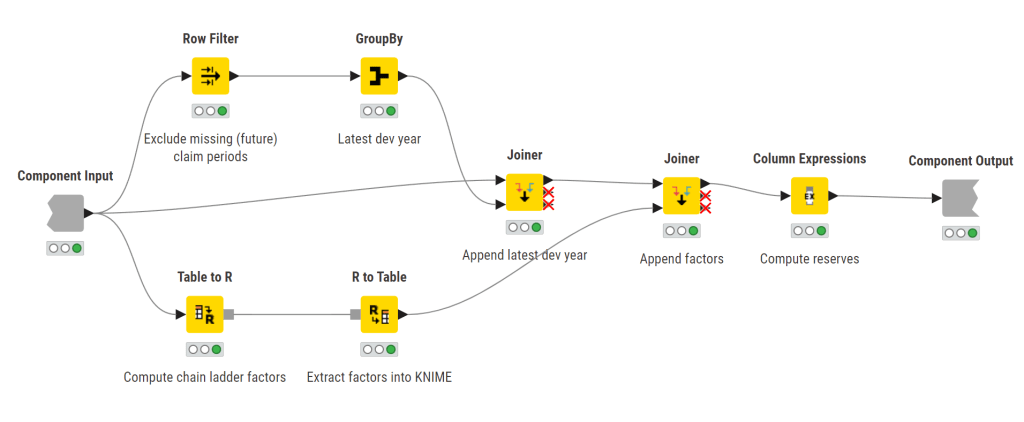
Here is the graph for this scenario using R. All of the work is being done in the Table to R and R to Table nodes. Table to R includes the R code. R to Table exports an R table into the KNIME environment.
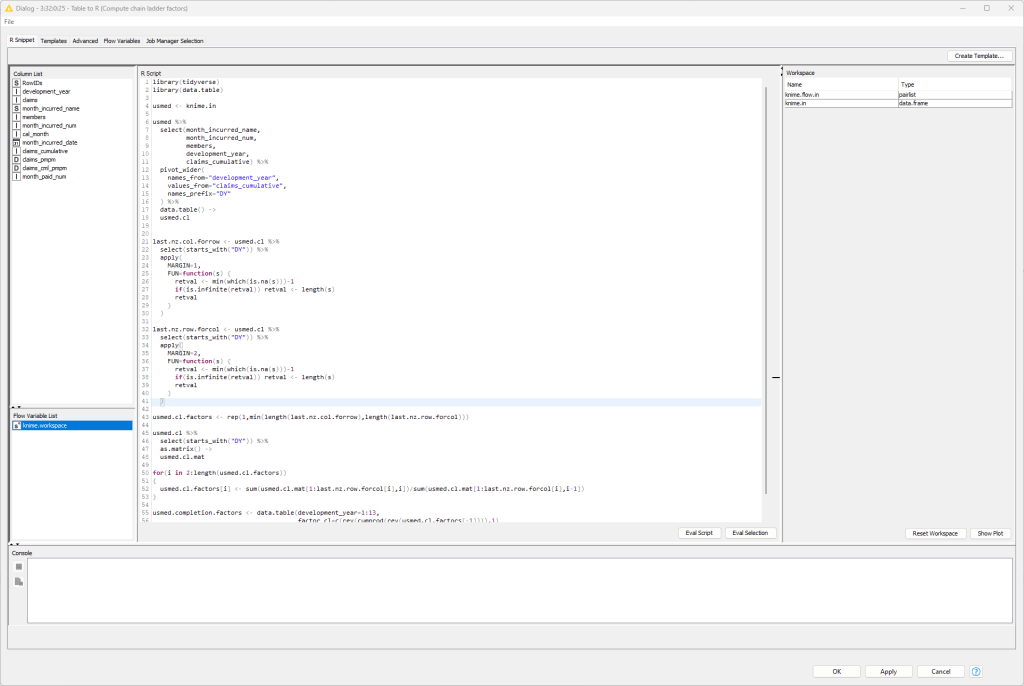
Here are the details of the Table to R node. This is in essence a full R environment.
As an aside, Python nodes are available as well.
The Other Components
I leave it to interested readers to check out the rest of the workflow for themselves. Here is what you will find:
- The H2O GLM Reserve component uses H2O GLMs to estimate the reserves. Running GLMs in KNIME proved difficult, and this is the best I could find.
- The R Poisson GLM Factors component uses R code to fit a Poisson GLM and extract development factors. It is a mere two nodes, as R does all the heavy lifting.
- The rest of the nodes combine the results (the series of Joiner nodes) and then set up a report. The Report component contains the pieces of the report which get assembled in the Report HTML Writer node. You will see heavy reliance on Python graphics in the Report node. In KNIME’s case, it relies heavily on external graphics engines for charts and plots.
An Unappreciated Feature
I want to point out an important and powerful insight. We didn’t just solve the business problem. We created a machine to solve the problem.
By changing the data input node, we can compute IBNR again for data with the same characteristics without changing a line of code or a single other node.
Low-Code Platforms vs. My (Ad Hoc) Criteria
Low-code platforms of the caliber of KNIME, Alteryx, and Dataiku do offer many advantages over Excel.
Flexibility
With practice, you will discover that these platforms are quite flexible without as much of the maintenance burden of Excel. It is hard to illustrate in a single case just how flexible these platforms are.
Limitations
No system is without its limits, and each low-code platform has some sort of limitation. However, compared to Excel, there are few seemingly arbitrary limits. One’s limitations tend to memory and processing power of one’s machines, and distributed computing is usually available for enterprise-grade installations.
Versioning
Versioning is handled differently by different platforms. I cannot speak to the adequacy of versioning. KNIME permits snapshotting, but this is not much different than making copies of Excel workbooks over time.
Transparency and Clarity
This example alone should illustrate to you how clear and transparent everything is relative to Excel. If formulas are hidden, they are easily found, and the logic of computation is easy to follow.
Auditability
Extending from the superior transparency and clarity is auditability. A peer reviewer, regulator, or auditor can readily follow what was done, quickly examine details, and even reproduce computations in their own toolset if needed.
Interoperability
While the situation with Excel has improved, interoperability with data, other programs, and the cloud remains “hacky”. The modularity of low-code systems readily enables seamless interoperability from the get-go.
Cost
We are all already paying for Microsoft for Excel. Enterprise-grade low-code systems are not inexpensive and often cost tens to hundreds of thousands of dollars per year. Based on my own experience with their scalability, there are significant long term payoffs in reduced headcount demand and efficiency over time that justify the investment. However, only you can decide the cost-benefit tradeoff of spending on low-code systems.
Closing Thoughts
Life insurance moves slowly, and the installed base of Excel workbooks is deep and far-ranging. Even if the industry were to adopt low-code solutions today, it would take a very long time to change.
That said, for the actuary on the street, low-code has come a long way and seems like a great tool to add to the toolset.
If you want to see more examples of actuarial work in a low-code world, please feel free to reach out. I hope you enjoyed this review.

Leave a comment